
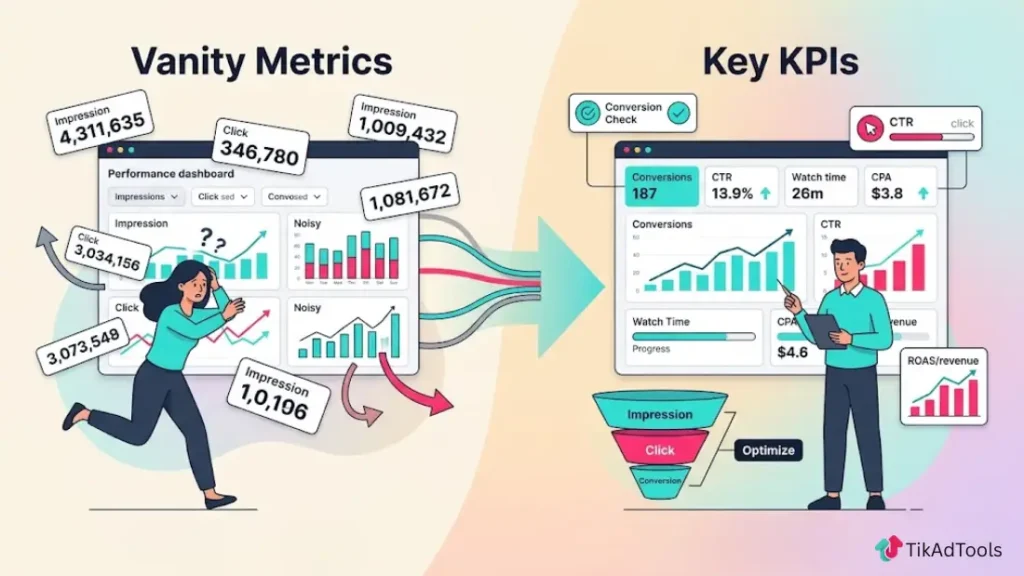
Most TikTok advertisers are watching the wrong numbers. They check impressions, see the count climbing, and assume the campaign is working.
They notice clicks and never stop to ask whether those clicks actually reached a destination. The result: budget spent on campaigns that look active and deliver nothing.
TikTok Ads Manager surfaces dozens of data points the moment your campaigns go live. Without a clear framework, those numbers create noise.
You end up reacting to the wrong signals, making optimization calls based on incomplete information.
This guide covers the 15 most essential TikTok ads metrics that actually move campaigns forward: what each one measures, when to use it, and how to read them together to find problems and scale what works.
Get Up to $6,000 in Free TikTok Ad Credits
TikTok offers ad credit incentives for new advertisers, helping you test campaigns with a lower upfront cost.
Table of Contents
What Are TikTok Ads Metrics?
TikTok ads metrics are quantitative data points inside TikTok Ads Manager that measure how your paid campaigns perform across delivery, engagement, cost, and conversions. The 15 most important ones fall into four categories: core performance, cost efficiency, conversions, and real-time optimization. Results vary based on your campaign objective, industry, and audience size, but only when you read these metrics together do they give you accurate, actionable signals.
Why TikTok Ads Metrics Matter for Campaign Performance
Every dollar you spend on TikTok either moves your business forward or disappears. Metrics are the only way to know which one is happening.
Without the right data, you are making guesses. You might pause a campaign that was three days away from converting. Or you keep running one that looks fine on the surface but is quietly draining your budget with no return.
We have seen campaigns with strong impressions and near-zero conversions. We have also seen low-impression campaigns with exceptional conversion rates. The same spend tells completely different stories depending on which numbers you look at, and in what order.
The right TikTok ads metrics give you a direct feedback loop between what you are spending and what you are actually getting back.
How to Read TikTok Ads Metrics by Funnel Stage
Not all metrics carry the same weight at every stage. Reading them out of sequence leads to wrong conclusions and wrong fixes.
Here is the framework we use before touching any campaign:
- Delivery stage: Start with impressions, reach, and frequency. These confirm your ad is being distributed, and to how many unique people.
- Engagement stage: Move to clicks (destination) and clicks (all). These show whether your creative is compelling enough to drive real action.
- Cost stage: Review CPC, cost per 1,000 people reached, and cost per conversion. These show how efficiently your budget is being used.
- Conversion stage: Check conversions, CVR by impressions, and CVR by clicks. These confirm whether your full funnel is actually working.
- Optimization stage: Pull real-time metrics last. These tell you what your campaign is doing right now, which is what matters for scaling decisions.
Work through each stage before moving to the next. A problem at stage one will distort every metric below it.
The 15 Most Important TikTok Ads Metrics Explained
TikTok Ads Manager defines all base metrics in their official reporting documentation. The explanations below go further to show you when and how to act on each one.
1. Impressions
Impressions count the total number of times your ad appeared on screen, including repeat views by the same user. This metric tracks delivery volume, not unique exposure.
Use it to confirm your ad is being served at scale. When impressions are low, the issue is usually budget, bid competitiveness, or audience size. Always read impressions alongside reach so you understand the full delivery picture before drawing any conclusions.
2. Reach
Reach tells you how many unique users saw your ad at least once, with duplicates removed. It is the clearest measure of how broadly your campaign is actually spreading.
If you are running a brand awareness or market entry campaign, reach is your lead metric. A campaign with deep impressions but low reach tells you the same audience is seeing your ad repeatedly. That is a frequency problem, and it tends to hurt performance before most advertisers notice it.
3. Frequency
Frequency is the average number of times each user saw your ad, calculated by dividing impressions by reach. When frequency climbs past 3 to 4, and conversions start dropping simultaneously, that is almost always ad fatigue.
The common mistake is adjusting the bid or the audience first. Nine times out of ten, the problem is the creative. Check frequency before you touch anything else in a declining campaign.
4. Clicks (Destination)
Clicks (destination) count only the clicks that send users to a specific URL: your website, app store, or landing page.
This is the only click metric that tells you how many people your ad pulled out of TikTok and into your actual funnel.
It filters out all social interactions, including comments, profile visits, and shares. For any traffic or conversion campaign, this is the click number you should be building your analysis around.
5. Clicks (All)
Clicks (all) captures every interaction with your ad: destination clicks, likes, comments, shares, and profile taps combined. This number will always be higher than destination clicks.
Use it to measure overall creative engagement and resonance with your audience. When clicks (all) are high, but clicks (destination) are low, your content is generating interest but not driving traffic. That is a call-to-action problem, not an audience problem. Those two diagnoses lead to very different fixes.
6. Cost
Cost is your total ad spend for the selected reporting period. It is the baseline every other efficiency calculation runs through. The key rule: never read cost in isolation. High spend with strong conversions is a healthy campaign worth scaling.
High spend with low conversions is a budget problem that gets worse every hour you leave it running. Cost only becomes meaningful when you put it next to what it produced.
7. CPC (Destination)
CPC (destination) is the average cost of each click that reached your target URL. You calculate it by dividing the total spend by destination clicks. According to the Business of Apps, TikTok CPC ranges from $0.25 to $4.00 depending on bidding strategy, audience targeting, and creative quality.
A CPC sitting above $2.50 without a strong downstream CVR is a signal to test a new hook or tighten your audience before increasing spend.
8. Cost per 1,000 People Reached
This metric shows how much you spend to reach 1,000 unique users. It is a different calculation from CPM, which divides spend by all impressions, including repeat views.
Cost per 1,000 people reached removes those repeat impressions from the equation, giving you a cleaner read on how far your budget is stretching across genuinely new people. Use it when audience breadth and efficiency matter more than raw delivery volume.
9. Cost per Conversion
Cost per conversion is the average amount you spend for each completed action your campaign is optimizing for, whether that is a purchase, form submission, or app install. This is your core profitability metric.
If your cost per conversion consistently exceeds the value of the action being completed, the campaign is unprofitable regardless of how strong every upstream metric looks. No amount of good impressions or CTR fixes that problem.
10. Conversions
Conversions count the total number of times your ad achieved the objective event you defined at campaign setup: purchases, signups, installs, or any other tracked action. Always read total conversions alongside cost per conversion and your two CVR figures.
A high conversion count paired with a rising cost per conversion means you are scaling volume but losing efficiency. Those two trends moving in opposite directions are a warning sign worth catching early.
11. Conversion Rate (CVR) – Impressions-Based
This CVR divides total conversions by total impressions. It measures the percentage of everyone who saw your ad and ultimately completed the goal action. Use it to evaluate overall campaign efficiency from the first delivery all the way to the final conversion.
A low impressions-based CVR usually points to a creative or targeting problem at the very top of your funnel, before any click has even happened.
12. Conversion Rate (CVR) – Clicks-Based
This CVR divides conversions by destination clicks. It measures how well your landing page converts the visitors who actually arrived from your ad. This version is more precise for diagnosing funnel breakdowns.
If impressions-based CVR is low and clicks-based CVR is also low, the issue is likely your post-click experience, not your ad. That distinction alone can save you from spending time optimizing the wrong thing.
13. Real-Time Conversions
Real-time conversions show conversion activity as it happens during an active campaign. This is your earliest performance signal.
If you launch a campaign and see zero real-time conversions after meaningful spend, that is a clear flag to pause and investigate.
Waiting for a daily summary report when live data is already telling you something is wrong is one of the most common and costly delays we see in active campaign management.
14. Real-Time Conversion Rate (CVR)
Real-time CVR updates your conversion rate live as your campaign runs. Use it to read whether a new ad or audience is finding traction early.
A strong real-time CVR within the first few hours means the algorithm is connecting with the right users and starting to optimize delivery toward them.
A flat or declining real-time CVR early on is usually a signal to adjust targeting or swap the creative before you have spent too much to pivot cleanly.
15. Real-Time Cost per Conversion
Real-time cost per conversion is the most direct signal for live scaling decisions. It updates your CPA in real time as spend accumulates.
When real-time cost per conversion holds below your target CPA after a meaningful amount of spend, you have a data-backed reason to increase your budget.
When it starts above your target from the first hour and does not improve, do not scale. Find the root cause first.
How to Track TikTok Ads Metrics in Ads Manager (Step-by-Step)
1. Log in to TikTok Ads Manager and open the Campaigns tab.
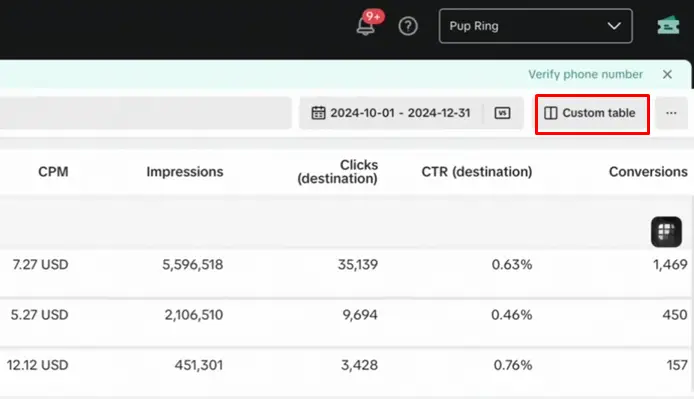
2. Click Customize Table to add the metrics you need. The default column set is limited. You will need to manually add CVR (clicks), cost per 1,000 people reached, and all three real-time metrics.
3. Set your date range to match your campaign flight exactly. Comparing metrics across periods with different budgets or audience conditions produces misleading numbers.
4. Toggle between Campaign, Ad Group, and Ad level reporting. Delivery and cost metrics read most cleanly at the campaign level. Creative performance, including CTR and CVR by ad, reads best at the individual ad level.
5. Use the Breakdown filter to segment by placement, age, gender, or device. This shows you which segments are driving your best CVR and your lowest cost per conversion, which is where you should be concentrating your budget.
Which TikTok Ads Metrics Matter Most for ROI and Scaling?
The answer depends on your objective, but here is a clear priority order for direct-response campaigns.
For profitability, cost per conversion and CVR (clicks-based) are your two most important signals. They tell you directly whether your funnel is generating a return on what you are spending.
For scaling decisions, real-time cost per conversion and real-time CVR should drive your calls. Never increase the budget based on yesterday’s aggregated data when live signals are available right now.
For creative optimization, the gap between clicks (destination) and clicks (all), combined with frequency, shows you whether your creative is driving real traffic or just passive engagement.
| Goal | Primary Metric | Supporting Metric |
| Profitability | Cost per conversion | CVR (clicks) |
| Scaling | Real-time cost per conversion | Real-time CVR |
| Creative testing | Clicks (destination) | Frequency |
| Audience reach | Reach | Cost per 1,000 reached |
| Funnel diagnosis | CVR (impressions) | CVR (clicks) |
TikTok Ads Benchmarks: 2026 Numbers by Metric
Benchmarks only help you if you know which source they came from and what campaign type they apply to. The numbers below are pulled from Lebesgue’s and Business of Apps, which aggregates data across multiple reporting sources.
Where figures vary by source, we have shown the range rather than flattening it into a single average that may not reflect your actual campaign conditions.
Your numbers will differ based on industry, region, ad format, creative quality, and bid strategy. Use these as a diagnostic baseline, not a fixed target.
Core Performance and Cost Benchmarks
| Metric | Benchmark Range | Notes |
| CTR | 4%–16% | The wide range reflects geography and format differences. US campaigns typically sit at the higher end (Business of Apps) |
| CPM | $1.82–$9.16 | The wide range reflects geography and format differences. US campaigns typically sit at the higher end |
| CPC (destination) | $0.17–$1.00 | $0.50 is Lebesgue’s reported median; $0.17–$0.40 reflects well-optimized campaigns per Gupta Media |
| CVR (clicks-based) | ~1.92% | Average for conversion-optimized campaigns across all conversion event types |
| CVR (e-commerce purchase) | ~0.46% | Specifically, the click-to-purchase completion rate is a harder action than general conversions |
| Cost per conversion | Varies by industry | No single average applies; always compare against your product margin and customer lifetime value |
| Minimum campaign spend | $500 | Specifically, the click-to-purchase completion rate, a harder action than general conversions |
We want to be clear about one thing: these are averages across categories and campaign types. A DTC fashion brand and a B2B software company will see very different numbers on the same platform with the same budget. Use these figures as a starting reference, not a hard target.
Common TikTok Ads Metrics Mistakes and How to Avoid Them
Treating impressions as a success signal. Impressions measure delivery volume, nothing more. Deep impressions with low reach and a flat CVR tell you your budget is cycling through the same audience with no real progress.
Confusing the two CVR formulas. CVR (impressions) and CVR (clicks) diagnose completely different problems. Using only one of them gives you a partial picture. If you only track one, you risk fixing the wrong part of your funnel.
Ignoring frequency spikes. When frequency climbs above 3 to 4 and performance drops, the instinct is to adjust targeting or increase the bid. The actual problem is almost always creative fatigue. Frequency is the first place to check.
Scaling on aggregated daily data. By the time your end-of-day summary updates, a campaign that stopped converting several hours ago may have already consumed a significant portion of your daily budget. Use real-time metrics for any live scaling decision.
Summing reach across ad groups. TikTok’s reporting documentation confirms that reach figures cannot be accurately summed across ad groups or campaigns because the platform removes duplicates at each level separately. Report reach at campaign level only. Use impressions for any aggregate-level reporting where you need to add numbers together.
How to Improve TikTok Ads Performance Using These Metrics
Use your metrics as a diagnostic tool, not just a reporting exercise.
If impressions are low: Your bid may be too conservative, or your audience is too narrow. Try broadening targeting or raising the daily budget before changing your creative.
If clicks (destination) are low relative to clicks (all): Your content generates engagement but not traffic. Strengthen your call to action and confirm your destination URL loads correctly on mobile.
If CVR (clicks) is low: The problem is on your landing page, not inside your ad. Check load speed, and look at whether your ad promise matches what your landing page actually delivers.
If the cost per conversion is above your target: Work backwards through the funnel. Start with CVR (clicks), then check CPC (destination), then look at audience overlap and frequency before adjusting your bid strategy.
If real-time CVR is declining early in a new campaign: Pause the ad group and review creative performance before spending further. Early TikTok signals compound quickly. A weak start rarely corrects on its own without a deliberate adjustment.
Frequently Asked Questions About TikTok Ads Metrics
What is the difference between TikTok impressions and reach?
Impressions count every time your ad appears on screen, including multiple exposures to the same person. Reach counts only the unique people who saw it at least once. You need both to understand your campaign fully. Impressions tell you how much volume your ad is generating. Reach tells you how many distinct people that volume is actually getting in front of. A large gap between the two usually signals that your creative is burning out on a small audience pool.
What is a good CTR for TikTok Ads in 2026?
According to Lebesgue’s 2026 ad performance data, the general platform average CTR for TikTok ads sits at 0.61%, with conversion-optimized campaigns averaging 0.84%. Anything consistently above 1% is strong for most campaign types. CTR varies by format: TopView and Brand Takeover placements tend to run significantly higher, while standard In-Feed video ads sit closer to the platform average. If your CTR is below the 0.61% baseline, the issue is almost always the first two seconds of your video.
What is the cost per 1,000 people reached on TikTok?
Cost per 1,000 people reached is a budget efficiency metric that shows how much you spend to get your ad in front of 1,000 unique users. It strips out repeat exposures to the same person, which CPM includes. When you are running a campaign where expanding your audience matters more than maximizing total impressions, this metric gives you a more honest read on how far your budget is stretching. Two campaigns with similar CPMs can look completely different when you calculate cost per 1,000 people reached.
What is the difference between CVR impressions and CVR clicks in TikTok Ads?
CVR (impressions) measures conversions as a percentage of everyone who saw your ad. CVR (clicks) measures conversions as a percentage of people who actually clicked through to your destination. The impressions-based figure will always be much lower because most people who see an ad do not click. What matters is using them together: a low-impressions-based CVR usually points to a top-of-funnel issue with your creative or targeting. A low clicks-based CVR usually points to a landing page problem. They diagnose different parts of the funnel.
How do real-time metrics work in TikTok Ads Manager?
Real-time metrics in TikTok Ads Manager update live during active campaigns. They include real-time conversions, real-time CVR, and real-time cost per conversion. You use them to make immediate decisions during live campaigns without waiting for daily summary data. They are most valuable in the first few hours of a new campaign or after a budget increase, when early signals are your most reliable indicator of whether the algorithm is finding the right audience. If real-time cost per conversion is already above your target early on, that is a signal to pause before spending further, not a reason to wait for more data.
Which TikTok Ads metrics should I prioritize for a new campaign?
For a brand new campaign, start with three metrics: reach, clicks (destination), and real-time cost per conversion. Reach confirms your ad is distributing broadly. Clicks (destination) confirms your creative is generating actual traffic, not just passive engagement. Real-time cost per conversion tells you whether the campaign is on track to be profitable before you have spent your full daily budget. Once the campaign has run long enough to gather meaningful data, add CVR (clicks) and cost per conversion to your regular review. Those two will drive most of your optimization decisions going forward.
Start With the Right Metrics, Then Scale What Works
Most TikTok ad campaigns do not fail because of budget. They fail because the data gets misread or read in the wrong order.
We have covered all 15 metrics in the sequence that actually reflects how TikTok’s algorithm distributes and evaluates your ads: from delivery, through engagement and cost efficiency, into conversion quality, and finally into the real-time signals that tell you what is happening right now. Each layer reveals a different diagnostic picture, and each one informs a different decision.
Reading any single metric in isolation produces an incomplete story. Reading them in sequence produces clarity you can act on immediately.
Start every new campaign by tracking three metrics: reach, clicks (destination), and real-time cost per conversion.
Once those tell you the campaign is healthy and reaching the right people, bring in cost per conversion and CVR (clicks) to guide your optimization from there. When those numbers hold steady at or below your targets, that is when you scale.
The 15 metrics in this guide are not a dashboard to stare at. They are a decision-making system. Use them that way.