
Most TikTok ad campaigns do not fail because of budget. They fail because the creative does not hold attention past the second scroll.
If your ads are getting impressions but not engagement, that is a signal. The algorithm reads it, your delivery costs go up, and your reach shrinks. The fix is not spending more. It is understanding what TikTok actually rewards.
TikTok ad engagement measures how users interact with your paid content, including likes, comments, shares, saves, and watch time. According to WebFX’s 2026 TikTok marketing benchmarks report, the average engagement rate ranges from 3.85% to 4.90%, while the average ad CTR sits at 0.84%. Your hook determines whether the algorithm distributes your ad or buries it, but results vary by industry, ad format, and creative approach.
In this article, you will get the 2026 benchmarks, a clear diagnostic framework, and the specific tactics that move the numbers.
Get Up to $6,000 in Free TikTok Ad Credits
TikTok offers ad credit incentives for new advertisers, helping you test campaigns with a lower upfront cost.
Table of Contents
What Is TikTok Ad Engagement and Why Does It Matter?
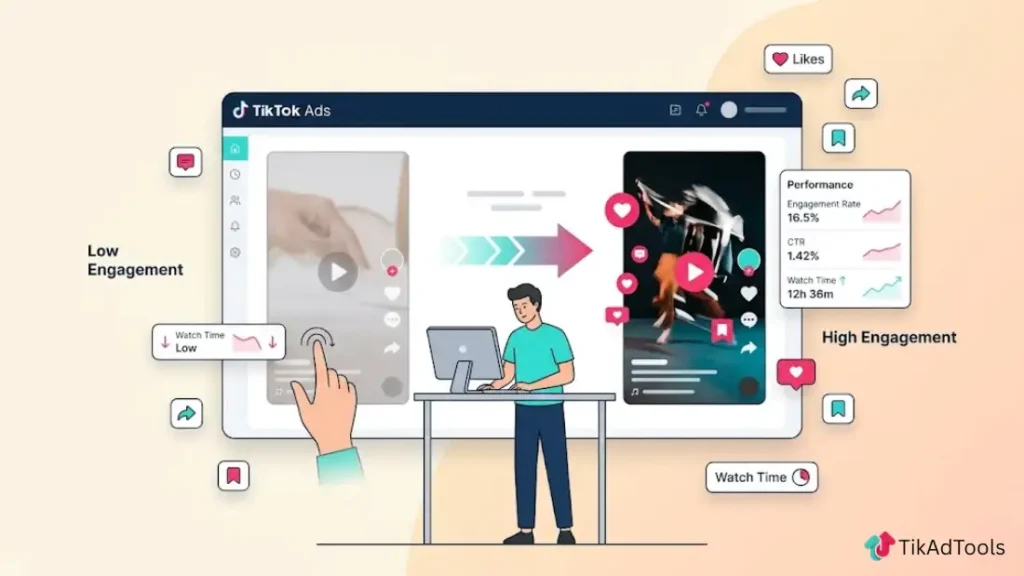
TikTok ad engagement reflects a range of metrics that measure real performance. It is a collection of signals that tell the algorithm whether users find your ad worth their attention.
When the platform sees strong engagement, it rewards you with wider distribution at a lower cost per impression. When engagement is weak, your CPM rises, and your reach shrinks. This feedback loop makes engagement the most important variable in your ad account.
Which Metrics Actually Count as Engagement on TikTok Ads
On TikTok, the engagement metrics that carry the most weight are:
- Likes: The baseline signal. Easy to earn, but the least powerful of the group.
- Comments: A stronger signal. They show emotional response and real intent.
- Shares: The highest-value organic action. A share is a direct recommendation to someone’s network.
- Saves: A strong intent signal, especially for product and tutorial-style ads.
- Watch time and completion rate: The algorithm’s primary engagement signals in 2026, above everything else.
Engagement vs. CTR vs. Conversion Rate: What Each One Tells You
These three metrics answer different questions, and you need all three to find where a campaign breaks down.
Engagement rate tells you whether your creative resonates. CTR tells you whether your call to action pulls people off the platform. Conversion rate tells you whether your landing page delivers on the ad’s promise.
A high engagement rate with a low CTR means the creative works, but the CTA is weak. A high CTR with a low conversion rate points to a landing page problem, not an ad problem.
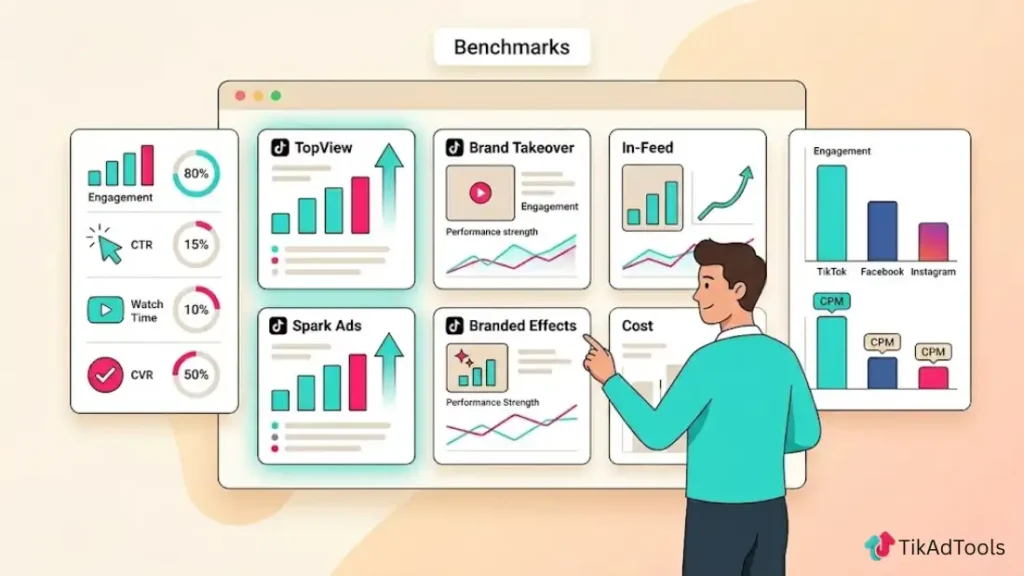
TikTok Ad Engagement Benchmarks for 2026
Engagement Rate, CTR, Watch Time, and CVR: Benchmark Table by Ad Format
The data below is sourced from WebFX’s 2026 TikTok marketing benchmarks report, AdLibrary’s 2026 CTR benchmarks analysis, and Lebesgue’s real-time ad performance dataset.
| Ad Format | Avg. Engagement Rate | Avg. CTR to Site | Best Use Case |
| TopView | 12–16% | 12–16% | Brand awareness, major launches |
| Brand Takeover | 7–10% | 7–10% | Mass reach, single message |
| In-Feed (Standard) | 5–7% ER | 1.5–3% | Mid-funnel, scalable reach |
| Spark Ads | 6–9%+ ER | 1.5–3%+ | Conversion, social proof |
| Branded Effects | 8% ER | Varies by CTA | Participation, UGC generation |
Average CVR for conversion-optimized TikTok ads is approximately 1.92%, based on Lebesgue’s ad performance data. Note that the eCommerce click-to-purchase CVR sits closer to 0.46% depending on landing page quality, targeting, and offer clarity.
How TikTok Compares to Meta and YouTube on Engagement
For video-format content specifically, TikTok leads most major platforms.
According to Swydo’s video marketing metrics report, average video engagement rates by platform are: TikTok at 3.8%–4.9%, Facebook Reels at 2.2%, and Instagram Reels at 1.2%–1.5%. On CPM, TikTok also runs cheaper.
WebFX reports TikTok’s average CPM at $9.16, compared to Meta’s $14.91 Facebook average. You get more engagement per impression and pay less per thousand views for now. That gap is narrowing as more advertisers enter the platform, so creative efficiency matters more today than it will 12 months out.
What Is a Good TikTok Ad Engagement Rate?
A good TikTok ad engagement rate in 2026 sits between 3.75% and 4.05%, based on Socialinsider’s benchmark analysis. For In-Feed ads specifically, anything above 5% signals strong creative performance.
For TopView and Brand Takeover formats, the benchmark rises to 12% or higher. These averages span industries, so your baseline will vary. In competitive verticals like fashion (avg. CTR: 0.25%) and technology (avg. CTR: 0.26%), you will start below the platform average, per AdLibrary’s 2026 industry breakdown.
Why Your TikTok Ads Are Getting Low Engagement
Low engagement almost always traces back to one of three causes. You lost the viewer before the message landed, your creative looked too polished, or you chose the wrong format for your campaign goal.
Weak Hooks: Losing Viewers in the First 3 Seconds
According to Koro’s TikTok ad statistics report, your hook rate target is 30% or higher. A hook rate below 20% means your opening frame is not stopping the scroll.
The most common mistake is starting with a logo, a tagline, or a slow product reveal. Your first frame needs to create a reason to pause, whether through movement, an unexpected visual, or a direct statement that speaks to what the viewer is already thinking. Users do not wait. They scroll.
Polished-Ad Syndrome: Why Overly Produced Content Underperforms
TikTok’s algorithm does not reward production value. It rewards attention retention.
WebFX’s 2026 benchmarks report notes that brands switching from polished promos to authentic, native-style storytelling often double their engagement. This is about matching the visual language of the For You Page, not about deliberately looking cheap. When an ad feels like a TV commercial, users scroll past it before your message even registers.
Wrong Ad Format for Your Campaign Objective
Choosing the wrong format is a budget problem disguised as a creative problem.
TopView is built for awareness. In-Feed is built for mid-funnel consideration. Spark Ads are built for conversion with social proof built in. If you run a direct-response campaign through TopView, you will get impressions but not clicks. Match your format to your funnel stage, not to your budget comfort zone.
How the TikTok Algorithm Scores Your Ads
TikTok’s algorithm is not passive. It scores your ad in real time and adjusts delivery based on those scores. Strong early signals mean wider reach at lower cost. Weak signals mean you pay more to reach fewer people.
Completion Rate, Engagement Velocity, and Watch Time as Ranking Signals
The three signals TikTok weights most heavily in 2026 are completion rate, engagement velocity (how fast likes, comments, and shares pile up after posting), and average watch time.
Swydo’s 2026 video marketing metrics report confirms that TikTok requires 75% or higher video completion for significant algorithmic distribution. ICUC’s 2026 TikTok guidance also recommends targeting 75% of video duration as your watch time benchmark for stronger distribution. If your completion rate sits below 40%, the platform treats it as friction. Distribution slows, and CPM rises.
Why the First 6 Seconds Determine Your Delivery Cost
TikTok uses early engagement signals to predict how an ad will perform at scale before it spends your budget widely.
According to Koro’s data, average watch time per ad is 3 to 5 seconds. Viral-level content reaches 8 seconds or more. The algorithm uses that early window to decide whether to keep distributing your ad or cap its reach. A strong first six seconds lowers your delivery cost because the algorithm predicts stronger downstream engagement. A weak opening means you pay more to reach fewer people.
Which TikTok Ad Format Gets the Most Engagement?
In-Feed, TopView, Spark Ads, and Branded Effects Compared
| Format | Best For | Avg. ER | Avg. CTR |
| TopView | Brand awareness, launches | 12–16% | 12–16% |
| Brand Takeover | Mass reach, single message | 7–10% | 7–10% |
| In-Feed (Standard) | Scalable reach, mid-funnel | 5–7% | 1.5–3% |
| Spark Ads | Conversion, social proof | 6–9%+ | 1.5–3%+ |
| Branded Effects | UGC generation, participation | 8% | Varies |
Source: AdLibrary 2026 CTR benchmarks report, WebFX 2026 TikTok marketing benchmarks.
Spark Ads vs. Standard In-Feed Ads: Which Drives Higher Engagement?
Spark Ads consistently outperform standard In-Feed ads on engagement.
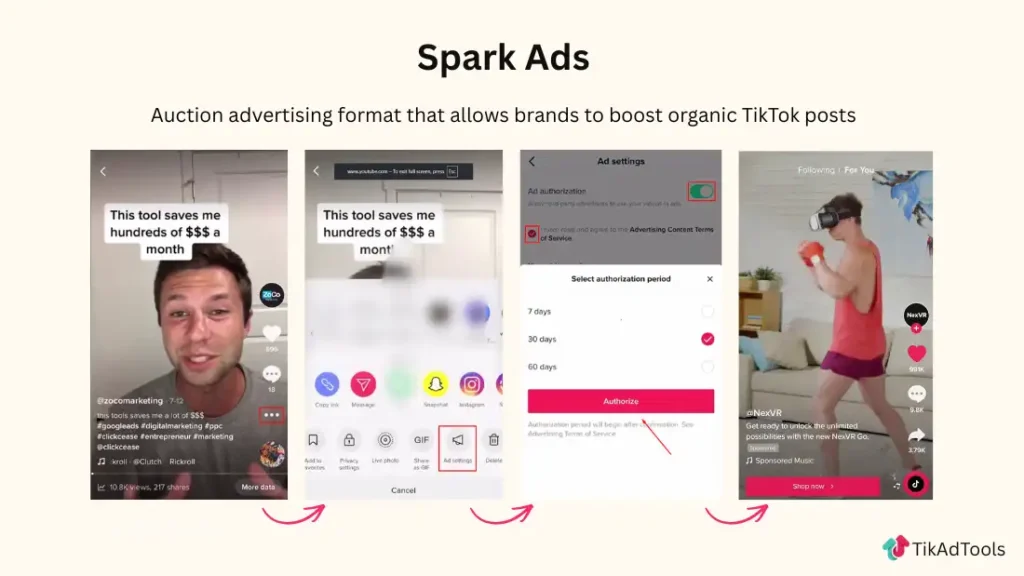
According to Amra and Elma’s TikTok Spark Ads statistics report, Spark Ads generate 142% higher engagement than standard ad units. The reason is trust. Spark Ads boost real organic posts, so they carry the creator’s existing social proof: real comments, real shares, real follower counts. A standard In-Feed ad starts from zero. Koro’s data suggests an 80/20 budget split as a starting point: 80% toward Spark Ads and 20% toward standard direct-response for retargeting.
Proven Ways to Boost TikTok Ad Engagement in 2026
Hook Strategy: What Works in the First 3 Seconds
Your hook has one job: stop the scroll. Three approaches consistently outperform the rest.
- Curiosity gap: Open with a claim or question that the viewer needs to resolve. Example: “Most brands waste their first $5,000 on TikTok doing this one thing.”
- Pattern interrupt: Use unexpected movement, sound, or visual contrast in the first half-second to break the scrolling rhythm.
- Direct address: Speak to a pain point your audience already lives with. “If your TikTok ads are not converting, here is the actual reason.”
Target a hook rate above 30%. If yours is below 20%, change the opening frame before touching anything else.
Native-Style Creative: Making Your Ad Feel Like Organic Content
The most effective TikTok ads in 2026 do not look like ads. They look like content from someone already in your audience’s For You Page.
Use vertical 9:16 format. Film in natural light when possible. Add on-screen text captions that support, not replace, the audio. Keep the pacing tight and the cuts fast. Drop anything that signals a production budget: polished transitions, stock footage, or your logo in the first few seconds. If your ad would look out of place in someone’s organic feed, it will underperform in paid placement too.
Sound-On Strategy: Trending Audio and Voiceover Best Practices
TikTok is fundamentally a sound-on platform. TikTok’s own research conducted with Kantar found that 88% of users consider sound essential to their TikTok experience, and TikTok is the only platform where ads with audio generate lifts in both purchase intent and brand favorability. Separately, about 93% of top-performing TikTok videos use music or sound clips, per data from Keywords Everywhere.
Use trending audio when it fits your message naturally. A voiceover that matches the video’s pace and energy outperforms text-only creative. If you are using a voiceover as a hook, lead with it in the first three seconds.
Creator and UGC Partnerships: Why Micro-Influencers Outperform Macro
Smaller, niche creators consistently outperform mega-influencers on engagement for paid campaigns.
According to data from The Influencer Marketing Factory, TikTok engagement rates range from 7.4% to 8.1%, depending on follower count, with smaller accounts consistently outperforming larger ones. The reason is simple: niche audiences trust niche voices.
Their content also matches the native style TikTok rewards algorithmically. If you are running UGC or creator partnerships, brief them on your hook strategy and give them room to deliver in their own voice.
How to Test and Scale What Actually Works
Testing on TikTok is not optional. Creative fatigue hits faster on this platform than on any other major ad channel, and you need a system to stay ahead of it.
Creative Testing Framework: 3–5 Variations per Ad Group
Run three to five creative variations per ad group from the start.TikTok’s own creative best practices guide recommends between three and five different creatives per ad group and three to five diversified ad groups per campaign.
Koro’s TikTok ad statistics add that brands spending more than $10,000 per month need to introduce three to five new creative concepts per week to maintain performance at scale.
Test one variable at a time: hook style, format, audio track, or CTA placement. Let each variation run long enough to collect meaningful data before you decide anything.
When and How to Refresh Creatives Before Engagement Drops
Do not wait for performance to fall apart before you act. Koro’s data shows the average high-performing TikTok creative lasts seven to ten days before engagement declines. TikTok’s own research, cited by Marpipe, puts the saturation window for consumer-facing campaigns at seven to ten days as well. Once your ad frequency exceeds 2.5 views per user, conversion rates typically fall by 30 to 40%.
Watch your frequency metric in TikTok Ads Manager every two to three days. When it crosses 2.5x, rotate in fresh creatives. For accounts spending $1,000 or more per day, that rotation may need to happen every three to four days.
How to Track TikTok Ad Engagement the Right Way
Key Metrics to Monitor in TikTok Ads Manager
Focus your daily monitoring on these six metrics:
- Hook rate (3-second view rate): Target above 30%. Below 20% means your opening is failing.
- Average watch time: Target six to eight seconds or above for In-Feed ads.
- Engagement rate: Benchmark against 3.70%–4.90% overall; 5%–7% for In-Feed format.
- CTR: The platform average is 0.84% per WebFX. Above 2% is considered excellent, per AdLibrary’s benchmarks.
- Frequency: Keep below 2.5x to prevent creative fatigue from cutting into your CVR.
- CPM: A rising CPM is often the first sign of creative fatigue, not just market cost increases.
Track Per-Video Engagement, Not Overall Averages
Your campaign average can mask serious weak spots. One strong creative can pull your account average up while two others quietly drain your budget.
Go into the creative reporting view in TikTok Ads Manager and sort by engagement rate, hook rate, and average watch time at the individual creative level. Find the structure of your top performer: its pacing, hook type, audio choice, and CTA placement. Build your next round of creatives around that structure. Do not let a healthy account average hide underperforming ads.
Explore these helpful articles next:
👉 TikTok Ads Credit, Coupon, and Promo Code: How to Get Up to $6,000 in Free Ad Spend
👉 TikTok Dynamic Showcase Ads: eCommerce Personalization
👉 TikTok Ad Scheduling: Best Times to Show Ads
👉 Organic Content to Paid: Transitioning TikTok Posts to Ads
TikTok Ad Engagement FAQs
What is a good engagement rate for TikTok ads?
A good TikTok ad engagement rate in 2026 sits between 3.70% and 4.90%, based on Socialinsider’s benchmark analysis of 70 million brand posts. For In-Feed ads specifically, 5%–7% ER signals strong creative performance. Results vary by industry: food and recipe content outperforms fashion and technology, which average CTRs of 0.25% and 0.26%, respectively, per AdLibrary’s 2026 breakdown.
How can I increase engagement on my TikTok ads?
You can increase TikTok ad engagement by strengthening your hook in the first three seconds, switching to native-style creative rather than polished brand videos, and running Spark Ads instead of standard In-Feed placements. According to Amra and Elma’s Spark Ads statistics report, Spark Ads generate 142% higher engagement than standard units because they carry the social proof from an existing organic post. Testing three to five creative variations per ad group from the start also makes a measurable difference.
Why are my TikTok ads getting views but no engagement?
Views without engagement usually mean users saw your ad but felt no reason to respond. The most common cause is a weak hook or creative that looks too produced for the platform. Pull your hook rate from TikTok Ads Manager. If it sits below 20%, your first three seconds are not stopping the scroll. Try a curiosity-based or direct-address hook and retest with the same audience before changing anything else.
What TikTok ad format gets the highest engagement rate?
TopView ads achieve the highest engagement rates, between 12% and 16%, per AdLibrary’s 2026 CTR benchmarks report. TopView is a premium format with a high minimum spend, so it suits brand awareness more than performance campaigns. For most advertisers, Spark Ads offer the best balance, with 6%–9%+ ER and 142% higher engagement than standard In-Feed ads per Amra and Elma’s data.
How do I know when to refresh my TikTok ad creative?
Watch your frequency metric in TikTok Ads Manager. When it crosses 2.5 views per user, conversion rates typically drop 30%–40%, per Koro’s TikTok ad statistics. High-performing creatives generally last seven to ten days before engagement starts falling, a timeline confirmed by both Koro and TikTok’s own research cited by Marpipe. For accounts spending $1,000 or more per day, expect to refresh every three to four days.
Does TikTok’s algorithm treat paid ads differently from organic content?
TikTok scores ads using the same core signals as organic content: completion rate, engagement velocity, and average watch time. Swydo’s 2026 video marketing metrics report confirms that TikTok requires 75% or higher video completion for meaningful algorithmic distribution. The critical difference with paid ads is that poor engagement directly raises your CPM. Weak creative becomes more expensive in real time because the algorithm predicts low downstream value and charges you more per impression to compensate.
Conclusion
TikTok ad engagement follows clear rules once you understand them. The platform rewards attention in the first three seconds, sustained watch time, and a creative that fits the visual rhythm of the For You Page. Ads that check those boxes cost less to run and reach more people.
We have walked through the 2026 benchmarks, so you know where your campaigns actually stand. We have mapped the most common reasons ads underperform, with a diagnostic framework that traces each problem to a specific cause. Every tactic covered here comes from platform data and verified campaign patterns.
The practical difference between a campaign that improves and one that stagnates comes down to testing volume and refresh discipline. Test more variations, rotate before engagement drops, and evaluate performance at the creative level, not the campaign average.
Once you treat creative as a repeatable system rather than a one-time execution, the platform starts working with you instead of against you.