
Running TikTok ads without checking the data behind them is like driving with your eyes closed. You might move forward, but you have no idea where you’re heading or what’s actually working.
Most advertisers open TikTok Ads Manager, glance at a few numbers, and walk away either excited or confused.
The real work starts when you know how to analyze TikTok ad performance using the right metrics in the right order, then act on what the data tells you.
Here’s what you’ll learn in this guide:
- The four core metrics that show if your campaigns are working
- How to read CTR, CPC, ROAS, and conversion data without guesswork
- A repeatable workflow for analyzing campaigns step by step
- Benchmarks to aim for in 2026 and how to set your own
- Mistakes that lead to wrong decisions and slower growth
By the end, you’ll have a method you can run every week to spot problems early and adjust campaigns with confidence.
Get Up to $6,000 in Free TikTok Ad Credits
TikTok offers ad credit incentives for new advertisers, helping you test campaigns with a lower upfront cost.
Table of Contents
Key Takeaways
- Click-through rate, cost per click, ROAS, and conversion rate are the four metrics that drive most decisions on TikTok ads.
- Real analysis happens at three layers: campaign, ad group, and ad, not just the top dashboard view.
- Numbers only matter when you compare them against your own goals, not vague industry averages.
- Creative fatigue often shows up in performance data days before sales actually drop.
- A weekly review beats daily metric-checking, which usually leads to overreactions.
Quick Answer
To analyze TikTok ad performance, open TikTok Ads Manager and track four metrics: CTR, CPC, ROAS, and conversion rate. Review the campaign, ad group, and ad levels separately. Compare data against your goals across at least 7 days, then change one variable at a time based on what the trends actually show.

What It Really Means to Analyze TikTok Ad Performance
Analyzing TikTok ad performance means reading your campaign data to judge if your spending produces the results you want. You compare metrics like CTR, CPC, ROAS, and conversion rate against your goals at each layer of the account, then make adjustments based on patterns instead of single-day swings.
Why TikTok Ad Data Behaves Differently From Other Platforms
TikTok ads work inside an entertainment feed, not a search engine or social timeline. Users scroll through dozens of videos in minutes, so attention windows are short and creative fatigue hits faster than on Meta or Google.
That changes how you read the numbers. Impressions can look inflated. Video view rates climb fast even when nobody buys. Hook rate in the first 3 seconds often predicts performance better than total watch time.
When you analyze your data, you’re really measuring how well your creative interrupts a scroll, holds attention, and pushes a next step. Strong performance shows up as a chain reaction across the funnel, not a single hero metric.
Where to Find Your TikTok Ad Performance Data
Your main hub is TikTok Ads Manager. After you log in, head to the Campaign tab and toggle between campaign, ad group, and ad views. Each view shows the same metrics at a different layer of the account.
The right side of the dashboard lets you customize columns. Add CTR, CPM, conversions, ROAS, and CPA, so they show up by default. Without this, you’ll keep clicking back and forth to compare numbers.
For deeper views, the Analyze tab gives you funnel breakdowns, audience reports, and creative performance data. The TikTok Business Help Center is the most reliable source for column definitions and reporting setup if you want to dig deeper.
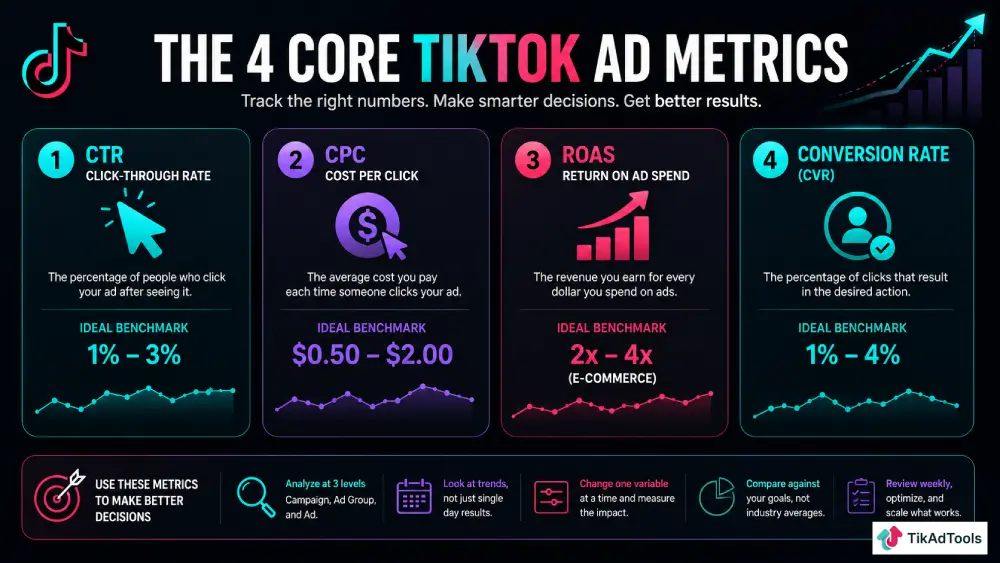
The 4 Core Metrics You Actually Need
You’ll see dozens of options inside Ads Manager, but four metrics carry the most weight for almost every campaign.
- Click-through rate (CTR)
- Cost per click (CPC)
- Return on ad spend (ROAS)
- Conversion rate (CVR)
Everything else, from CPM to video view rate, supports those four. Track them by ad group and creative, not just at the campaign level. A complete breakdown of supporting TikTok ad metrics is worth bookmarking if you want a fuller reference.
How to Read CTR on TikTok Ads
Click-through rate shows what percentage of viewers tapped your ad after seeing it. On TikTok, a healthy CTR usually sits between 1% and 3%, though strong creatives can push higher.
Low CTR almost always points to a creative problem. Maybe your first 3 seconds don’t grab attention, or the visual feels too polished for the feed. If you’re stuck, this low CTR troubleshooting guide walks through the common fixes.
High CTR with poor sales tells a different story. Your ad gets attention, but the landing page or product doesn’t deliver on the promise. That’s a funnel issue, not a creative one.
How to Read CPC and What It Really Tells You
Cost per click measures what you pay each time someone taps your ad. It ties together your bid, audience match, and creative quality into one number.
Rising CPC over time usually means one of three things:
- Your audience is too narrow, and frequency is climbing
- Your creative is wearing out
- Auction competition has grown in your niche
A high CPC isn’t always bad. If those clicks turn into high-value buyers, you can afford to pay more. Always pair CPC with conversion data before reacting to it.
How to Read ROAS Without Fooling Yourself
Return on ad spend tells you how much revenue you earn for every dollar spent. A ROAS of 3 means you made $3 for every $1 invested. Most ecommerce brands aim for ROAS between 2 and 4, though the real target depends on your margins.
Be careful with attribution. TikTok’s reporting can credit conversions that other platforms also claim. Compare your TikTok ROAS performance against your overall blended return across all channels to get a more honest picture.
How to Read Conversion Rate
Conversion rate is the share of clicks that complete the action you want, whether that’s a purchase, sign-up, or lead form submit. It’s the closest signal to whether your funnel works from start to finish.
If CTR is strong but the conversion rate is weak, your funnel breaks after the click. Check page load speed, mobile design, and how well the landing page matches the ad’s promise.
If the conversion rate is steady but the volume is low, the bottleneck sits higher up. Look at reach, audience size, or budget instead of blaming the page.
A Step-by-Step Workflow for Analyzing Campaigns
A clear process beats random metric-checking. Use this workflow once a week.
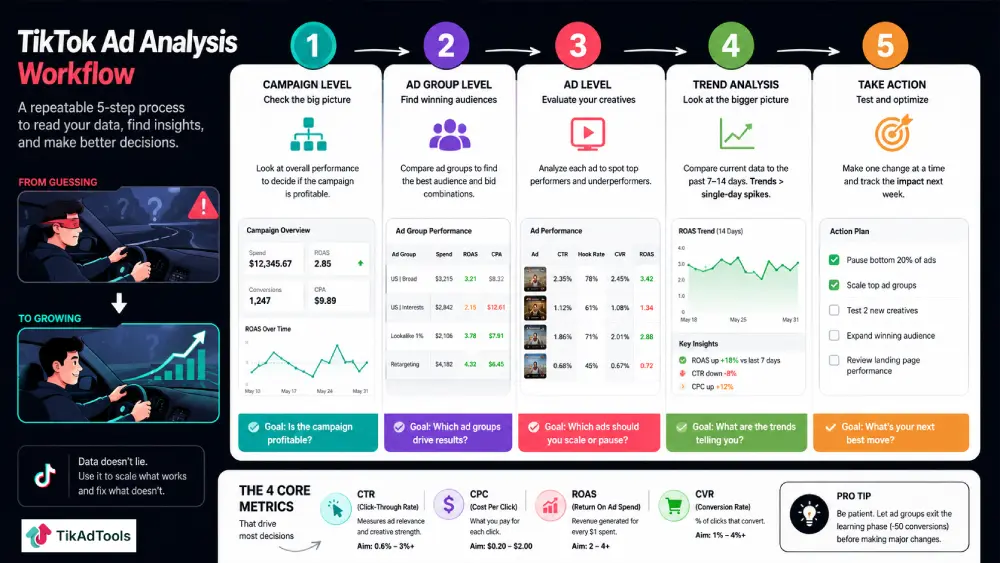
Step 1: Start at the campaign level. Look at total spend, ROAS, and conversions. Decide if the campaign is profitable.
Step 2: Drop into the ad group view. Check which audience and bid combinations drive results. Pause groups that have spent twice your target CPA without converting.
Step 3: Open the ad level. Look at CTR, hook rate, and video view duration. Kill the bottom 20% of creatives.
Step 4: Compare current data against the past 7 to 14 days. Trends matter more than single-day spikes.
Step 5: Document one change per week. Changing too many variables makes it impossible to tell what actually worked.
TikTok Ad Benchmarks to Aim For in 2026
Benchmarks vary by industry, but these ranges give you a useful starting point.
| Metric | Range to Aim For |
| CTR | 0.61% |
| CPC | $0.20 to $2.00 |
| CPM | $4.8 |
| ROAS | 2 to 4 (ecommerce) |
| Conversion Rate | 1% to 4% |
Treat these as reference points, not goals. A subscription brand with high lifetime value can run profitably at a 1.5 ROAS. A low-margin physical product might need a 4-plus ROAS to break even.
What to Do When the Numbers Drop
A dip in performance doesn’t always mean panic. First, check if anything changed in the last 7 days: new creative, budget shift, audience update, or a seasonal factor.
If creative fatigue is the cause, swap in fresh hooks rather than rebuilding the whole campaign. If the conversion rate fell, look outside the ad: site speed, checkout flow, or inventory issues are common culprits.
Avoid making changes during the learning phase. TikTok’s algorithm needs roughly 50 conversions per ad group before performance stabilizes, and edits reset that learning.
Common Mistakes That Skew Your Analysis
These habits trick advertisers into wrong conclusions:
- Judging campaigns after one or two days of data
- Comparing TikTok ROAS to Meta ROAS without adjusting for attribution differences
- Pausing ads based on single-metric dips instead of full-funnel context
- Ignoring placement breakdowns and watching only top-line numbers
- Setting up reports before conversion tracking is properly installed
The fix for most of these is patience and a consistent reporting structure. Build one dashboard you trust, and stick with it long enough to spot real patterns.
Tools That Make Analysis Easier
TikTok Ads Manager covers most needs, but a few extras can save hours.
- Custom dashboards built in Looker Studio for clearer client reporting
- A spreadsheet for tracking weekly performance changes and notes
- A creative testing tracker so you know which hooks and angles you’ve already tested
- The TikTok Pixel and Events API for accurate conversion tracking
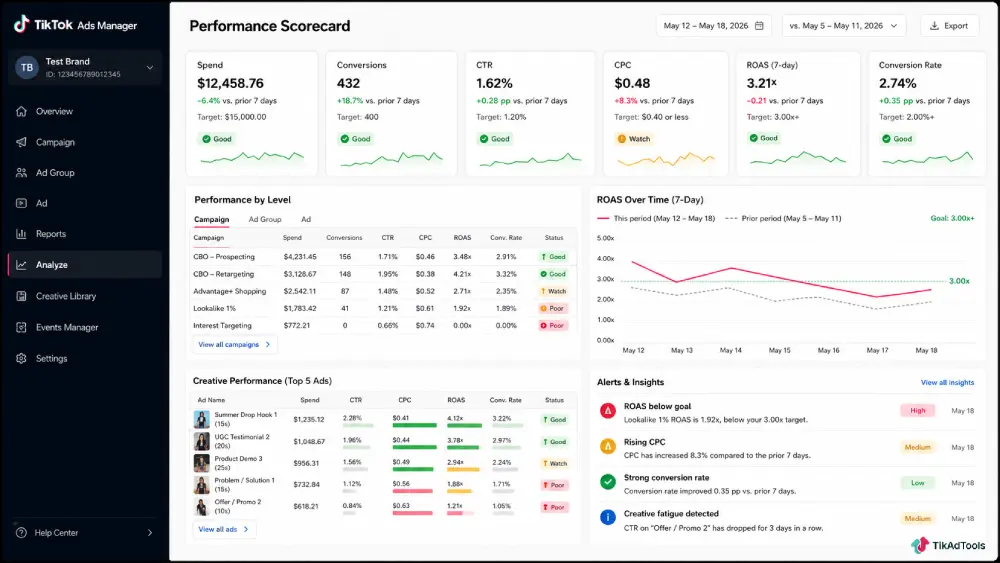
You can also build a simple performance scorecard in Google Sheets that flags red and green metrics automatically. Sometimes the lowest-tech setup gives the clearest view of what’s working.
A short note worth adding: if you want a calculator-style approach to projecting profitable spend, a TikTok ROAS or break-even calculator can make weekly reviews much faster.
How Analysis Connects to Optimization
Reading data is only half the job. The other half is acting on it without breaking what’s already working. Small, focused changes win on TikTok: one hook swap, one audience tweak, one bid adjustment per week.
For a deeper breakdown of how to move from insight to action, the full guide on TikTok ad optimization covers the levers worth pulling and the order to pull them in.
FAQs
How often should you analyze TikTok ad performance?
Review your campaigns at least once a week, with a deeper audit each month. Daily checking leads to overreactions during the learning phase. A weekly cadence gives you enough data to spot real trends without panicking over normal day-to-day swings.
What’s the most important TikTok ad metric?
The most important metric depends on your goal. For ecommerce, ROAS matters most. For lead generation, cost per lead and conversion rate take priority. For awareness, CPM and reach matter more than clicks. Always tie metrics back to outcomes, not vanity numbers.
Why does my TikTok ad have high CTR but low sales?
High CTR with low sales usually means your ad attracts curiosity, but your landing page or offer doesn’t convert. Check that your hook matches the offer, that the page loads fast on mobile, and that the next step after the click feels like a natural continuation of the ad.
How long should you run a TikTok ad before judging it?
Wait at least 3 to 7 days and 50 conversions per ad group before judging performance. TikTok’s algorithm spends the first phase learning who responds to your creative. Cutting ads too early throws away that learning and forces a full reset.
Can you analyze TikTok ad performance without conversion tracking?
You can review surface metrics like CTR, CPM, and video view rate, but real analysis needs conversion data. Without the TikTok Pixel or Events API, you’re guessing at what drives revenue. Set up tracking properly before scaling spend on any campaign.
What does CPM tell you on TikTok?
CPM is the cost to reach 1,000 people. A rising CPM often signals tighter targeting, higher auction pressure, or weaker creative engagement. Use it alongside CTR to judge if your ad is being delivered efficiently to the right audience at the right price.
Pulling It All Together
Strong TikTok ad analysis comes down to a clear process and the discipline to follow it week after week. Track the four metrics that matter, segment your data by campaign, ad group, and ad, and judge performance against your own goals rather than industry averages.
The advertisers who win on TikTok aren’t the ones with the most dashboards. They’re the ones who read their data weekly, change one thing at a time, and trust trends over single-day spikes.
Pick one campaign this week, run the workflow above, and document what you find. That single habit will teach you more about TikTok ads than any benchmark chart ever could.