
If you try to read TikTok ads data like you read Facebook ads data, you will lose money.
On Meta, the click is king. On TikTok, the scroll is king. The user journey is fundamentally different, faster, more chaotic, and less linear.
A user might watch your video, scroll past, and then search for your brand three days later.
If you are only looking at Last Click ROAS, you are likely turning off your best brand-building campaigns because they look expensive on paper.
Get Up to $6,000 in Free TikTok Ad Credits
TikTok offers ad credit incentives for new advertisers, helping you test campaigns with a lower upfront cost.
In 2026, reading performance data isn’t just about checking how much money you made yesterday.
It is about analyzing Creative Velocity (how fast your ads are fatiguing) and Attribution Lag (the time between view and purchase).
This guide replaces the guesswork with a rigorous, data-driven framework for interpreting your TikTok Ads Manager dashboard, setting up the correct custom columns, and making decisions that actually scale profit.
Table of Contents
Quick Summary
- The Vanity Trap: High CTR (Click-Through Rate) on TikTok does not always equal high intent. Often, it just means you had a clickbait hook. Always cross-reference CTR with Hold Rate.
- The Golden Metric: Hook Rate (2-Second View Rate) is your primary diagnostic. If you can’t stop the scroll, nothing else in your funnel matters. Aim for >30%.
- Attribution Reality: TikTok defaults to a Click + View attribution window. This means your dashboard numbers will always look higher than your Shopify/GA4 numbers. You must use Attribution Analytics to see the truth.
- The Focused View Signal: Optimize for 6-Second Focused Views. Users who watch 6+ seconds are 3x more likely to convert than those who click immediately.
- Creative Fatigue: On TikTok, creative dies in days, not weeks. Monitor your CPA trendline daily; a 3-day rising trend usually means the creative is burned out.
1. The Setup: Custom Columns for clarity
The default dashboard view in TikTok Ads Manager is useless. It hides the metrics that actually explain why an ad is working or failing.
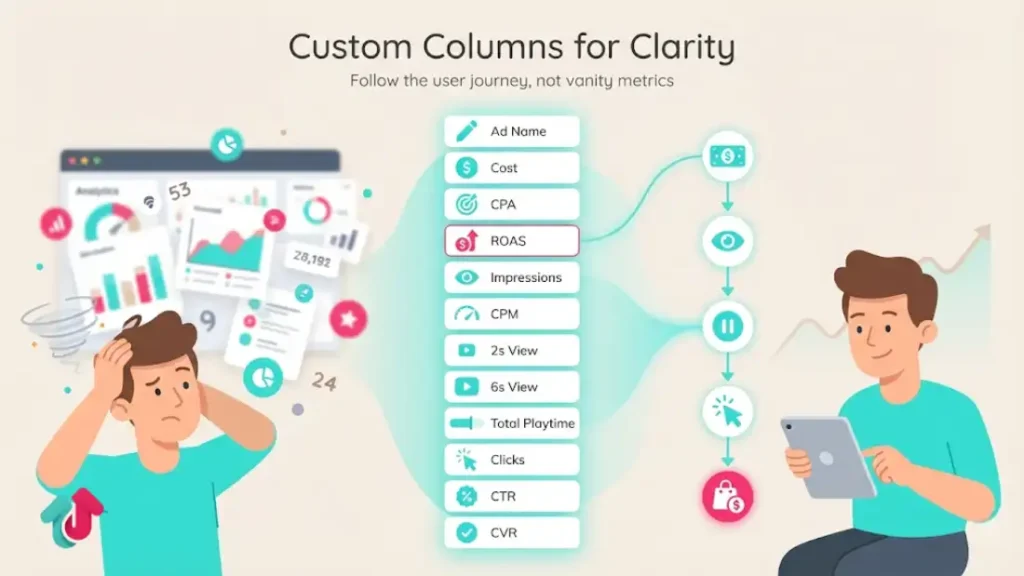
You need to create a Creative Analysis column preset.
Step-by-Step Configuration:
Go to Columns > Custom Columns.
Clear the defaults and add these metrics in this exact order:
- Ad Name (Naming convention is critical)
- Cost (Total Spend)
- CPA (Cost Per Action)
- ROAS (Return on Ad Spend)
- Impressions
- CPM (Cost of traffic)
- 2-Second Video Views
- 6-Second Video Views
- Total Playtime
- Clicks (Destination)
- CTR (Destination)
- Conversion Rate (CVR)
Why this order?
It follows the user journey: Cost (Input) → Reach (CPM) → Stop Scroll (2s View) → Engagement (6s View/Click) → Money (ROAS).
2. The Creative Metrics: Diagnosing the Video
When an ad fails, don’t just guess. Use these three ratios to pinpoint the exact moment the user lost interest.
A. Hook Rate (The Thumb-Stop Metric)
Formula: 2-Second Video Views / Impressions
What it means: Did the first frame and opening line stop the scroll?
Benchmark (2026): 30% is the goal. Anything under 20% means your opening hook is weak.
Fix: Don’t scrap the video. Just re-edit the first 3 seconds with a visual pattern interrupt or a more controversial headline.
B. Hold Rate (The Retention Metric)
Formula: 6-Second Video Views / 2-Second Video Views
What it means: Of the people you hooked, how many stayed for the meat of the story?
Benchmark: 25% – 40%.
Fix: If this is low, your video is boring in the middle. Add B-roll changes, text overlays, or a beat drop at the 4-second mark to re-engage the brain.
C. Click-Through Rate (The Desire Metric)
Formula: Clicks / Impressions
Benchmark: 1.0% – 1.5% for direct response.
Fix: If Retention is high but CTR is low, your Call to Action (CTA) is weak. You entertained them, but you didn’t give them a reason to leave the app.
3. Attribution: Why Your Data Doesn’t Match Shopify
This is the #1 source of confusion. Your TikTok dashboard says 100 sales; Shopify says 60. Why?
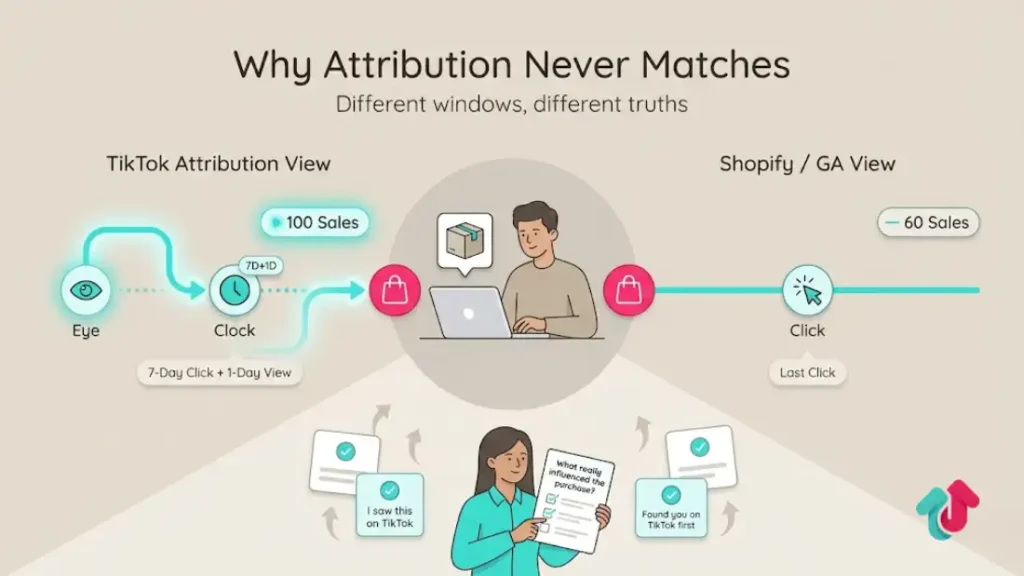
The Default Window:
TikTok reports on a 7-Day Click + 1-Day View window.
- If a user sees your ad (doesn’t click) and buys the next morning, TikTok claims credit.
- Shopify/Google Analytics typically uses Last Click. They will attribute that sale to Direct or Organic Search.
How to Read It:
Do not try to make them match. Use TikTok data to measure relative performance (Ad A vs. Ad B) and platform impact.
Use Post-Purchase Surveys (e.g., KnoCommerce, Fairing) to triangulate the truth. If TikTok says 100 sales and your survey says I saw you on TikTok for 80 of them, you know the View-Through data is valid.
4. Benchmarks for 2026 (eCommerce)
Context is everything. Here is what Good looks like in the current landscape.
| Metric | Average | Great (Top 20%) |
| CPM | $9.00 – $12.00 | < $7.00 |
| CPC | $0.80 – $1.20 | < $0.60 |
| CTR | 0.90% | > 1.50% |
| Conversion Rate (CVR) | 1.2% | > 2.5% |
| Hook Rate (2s) | 22% | > 35% |
Pro Tip: Benchmarks vary wildly by industry. B2B CPMs will be higher ($15+), while fast fashion CPMs might be lower ($5). Focus on beating your historic average, not global averages.
5. The Optimization Workflow
How often should you touch the ads?
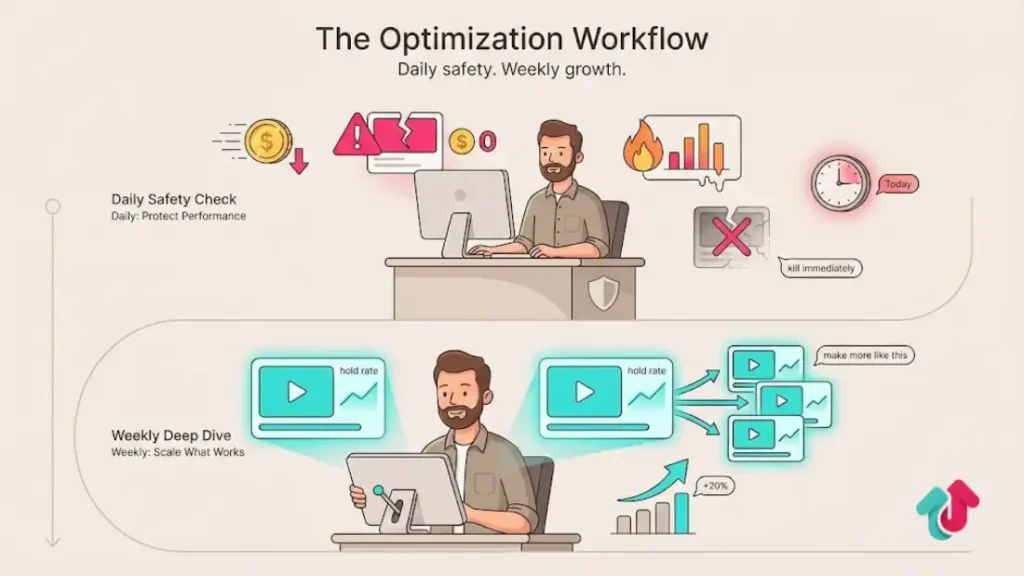
Daily Routine (The Safety Check)
Check Spend: Are we pacing correctly?
Check CPA: Is any ad group spending >2x your target CPA with zero sales? Kill it immediately.
Check CPM Spikes: Did CPM jump 50% overnight? This usually indicates creative fatigue. Plan to launch fresh creative within 24 hours.
Weekly Routine (The Deep Dive)
Creative Analysis: Pull a report of the last 7 days. Identify the top 3 videos by Hold Rate. Send these to your creative team and say, Make more like this.
Scaling: Identify ad groups with a stable CPA and high ROAS. Increase their budget by 20% (do not double it, or you’ll reset the learning phase).
Explore these helpful articles next:
👉 TikTok Ads for B2B Brands: Does It Work?
👉 TikTok Dynamic Showcase Ads: eCommerce Personalization
👉 Vertical Video Storytelling for TikTok Ads
👉 TikTok Ads Strategy for High-Ticket Products in New Year Sale
FAQ: TikTok Ads Reporting
Why is my TikTok ROAS so high but my bank account is empty?
You are likely looking at View-Through Attribution. TikTok is claiming credit for people who saw your ad but might have bought anyway (e.g., existing customers). Check your Attribution Settings and look at Click-Through Conversions only to see the most conservative view of your cash flow.
What does the Learning Phase actually mean?
It means the algorithm is guessing. Until an ad group gets 50 conversions in a week, the data is volatile. Don’t make major decisions (like killing an ad) based on day 1 or 2 data unless the spend is astronomically high without results.
How do I track iOS 18+ users accurately?
You cannot track them perfectly with a Pixel alone due to privacy blocks. You must enable the Events API (Server-Side Tracking) to capture these signals directly from your backend. Without Events API, you are missing 30% of your data.
My CTR is 3% but no sales. Why?
You have Clickbait creative. You promised something huge (or showed something misleading) that got the click, but the landing page didn’t deliver on that promise. Align your ad hook with your landing page headline.
Should I look at Total Playtime?
Yes, for deciding which ads to scale. If Ad A and Ad B have the same CPA, but Ad A has double the Total Playtime, scale Ad A. It is retaining users better, which means TikTok will eventually give it a lower CPM, making it more profitable in the long run.
Conclusion
Reading TikTok ads data is a practice of triangulation.
You must balance the Hard Metrics (ROAS, CPA) with the Soft Metrics (Hook Rate, Hold Rate).
The Hard Metrics tell you how much money you made; the Soft Metrics tell you how long you will keep making it.
Next Step: Log into your Ads Manager right now and set up the Creative Analysis column preset listed in Section 1. Stop looking at the default view; it is blinding you to the reality of your account performance.