
You launched your first TikTok campaign yesterday. You wake up, open the Ads Manager, and are greeted by a wall of numbers. Some are green, some are red, and you have no idea if you made money or burned it.
This is the Dashboard Paralysis that kills most beginner campaigns.
The mistake most new advertisers make is obsessing over the wrong metric at the wrong time.
Get Up to $6,000 in Free TikTok Ad Credits
TikTok offers ad credit incentives for new advertisers, helping you test campaigns with a lower upfront cost.
If you look at ROAS (Return on Ad Spend) on Day 1, you might turn off a winning ad because the sales data hasn’t synced yet. If you look at Likes, you might scale a losing ad that is viral but not profitable.
You need a systematic workflow, a checklist you run through every morning, to strip away the emotion and make decisions based on cold, hard data.
This guide gives you that exact workflow. We will set up your custom columns, define the safe timeframes for analysis, and give you a simple If This, Then That logic to fix broken ads.
Table of Contents
Quick Summary
- The 72-Hour Rule: Never analyze ad performance for the current day. Attribution lag means sales often take 24 – 48 hours to show up in the dashboard.
- The Funnel Approach: Analyze in order of the user journey: Hook Rate (Attention) > CTR (Interest) > CPA (Action).
- Diagnostic Metrics: If your Hook Rate is below 25%, your video intro is the problem. If your CTR is below 0.8%, your offer or CTA is the problem.
- The Kill Threshold: If an ad spends 1.5x your target CPA with zero sales, turn it off immediately.
- Column Setup: You must customize your dashboard columns. The default view hides the most important creative data like 2-Second Video Views.
What is TikTok Ad Analysis?
TikTok Ad Analysis is the process of evaluating campaign data to determine profitability and creative efficiency.
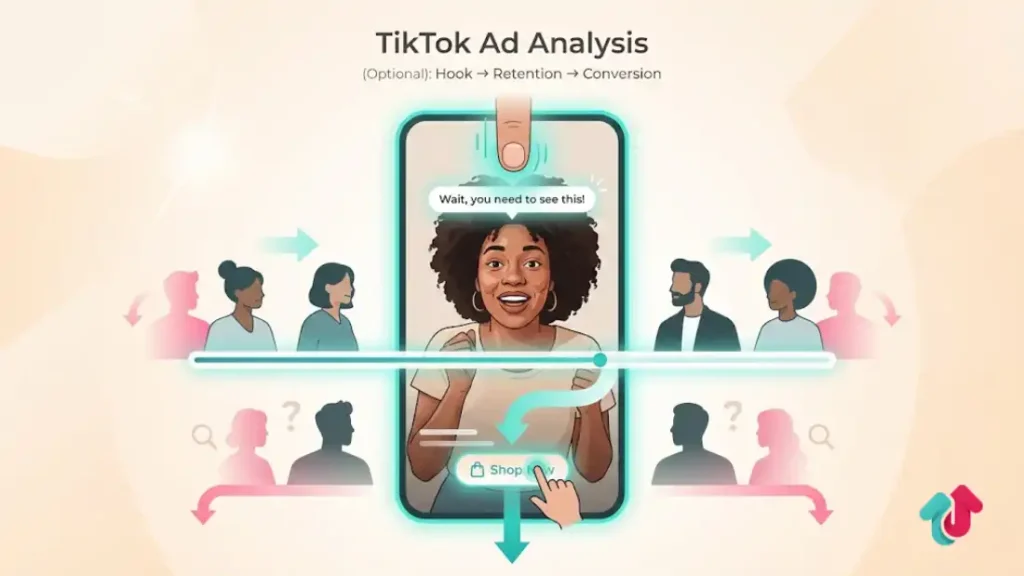
Unlike passive platforms, TikTok analysis requires a creative-first approach, measuring how effectively a video stops the scroll (Hook Rate), holds attention (Retention Rate), and drives action (Conversion Rate).
This diagnostic process allows advertisers to identify exactly where users are dropping off in the funnel.
Phase 1: The Setup (Custom Columns)
You cannot fix what you cannot see. The default view in TikTok Ads Manager is useless for deep analysis. You must create a Custom Column preset.
Action Step: Go to Ads Manager > Campaigns > Columns > Custom Columns. Check the boxes for these exact metrics in this order:
- Cost: (Total Spend)
- CPC: (Cost Per Click)
- CPM: (Cost Per Mille / 1,000 impressions)
- CTR: (Click-Through Rate – Destination)
- Conversions: (Total Sales/Leads)
- CPA: (Cost Per Acquisition)
- Video Views (2-Second): (Crucial for Hook Rate)
- Video Views (6-Second): (Crucial for Hold Rate)
- ROAS: (Return on Ad Spend)
Save this preset as Daily Check. Now you have a clean workspace.
Phase 2: The Timeframe Rule
Before you judge your ads, you must select the right date range.
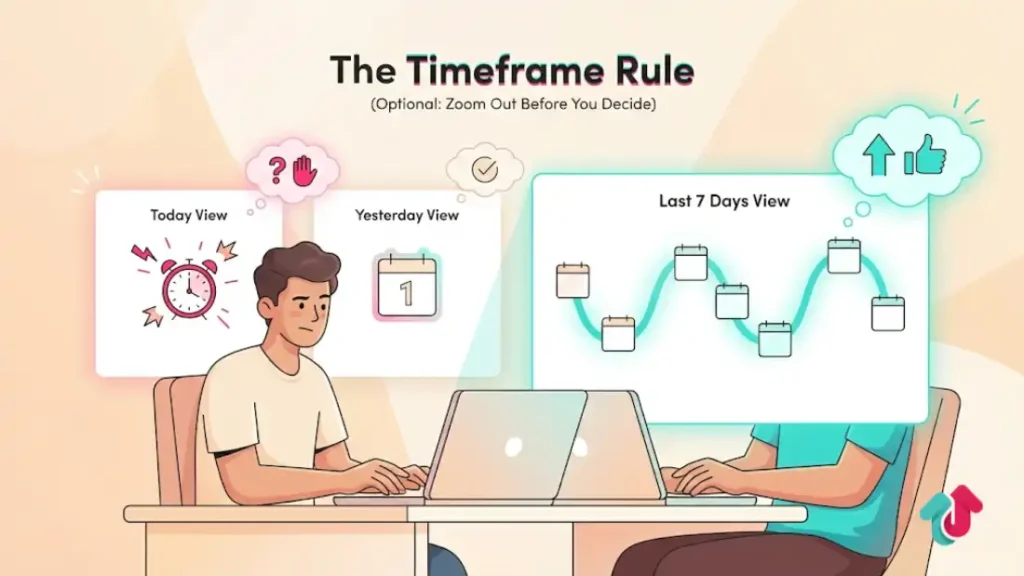
Do Not Look at Today: TikTok data is not real-time. Conversions are often reported with a delay. Judging an ad by 10 AM on the same day leads to premature panic.
The Last 7 Days View: This is the most accurate view for established campaigns. It smooths out daily volatility.
The Yesterday View: Use this for a quick morning check to ensure spend is pacing correctly, but do not make major decisions based solely on yesterday’s numbers unless something broke completely.
Phase 3: The Funnel Analysis Workflow
Run this diagnostic check from top to bottom. Imagine you are following the user’s journey.
Step 1: Check the Hook (Did they stop?)
Look at your Hook Rate.
Formula: 2-Second Video Views / Impressions
Benchmark: >25%
Analysis: If your Hook Rate is 10%, your video intro is boring. The user never gave you a chance.
Fix: Re-edit the first 3 seconds with a visual shock or text overlay.
Step 2: Check the Interest (Did they click?)
Look at your Click-Through Rate (CTR).
Benchmark: >0.8% (for eCommerce)
Analysis:
- If Hook Rate is high (30%) but CTR is low (0.4%), you have Clickbait. You grabbed attention but didn’t sell the click.
- Fix: Improving your Call-To-Action (CTA) or making the product benefit clearer in the middle of the video.
Step 3: Check the Sale (Did they buy?)
Look at your Cost Per Acquisition (CPA) and Conversion Rate (CVR).
Benchmark: CPA should be profitable (e.g., <$20). CVR should be >1.0%.
Analysis:
- If CTR is high (>1.5%) but nobody is buying, your ad is fine. Your Website is the problem.
- Fix: Check your load speed, shipping price, or product pricing. The ad did its job; the site failed to close.
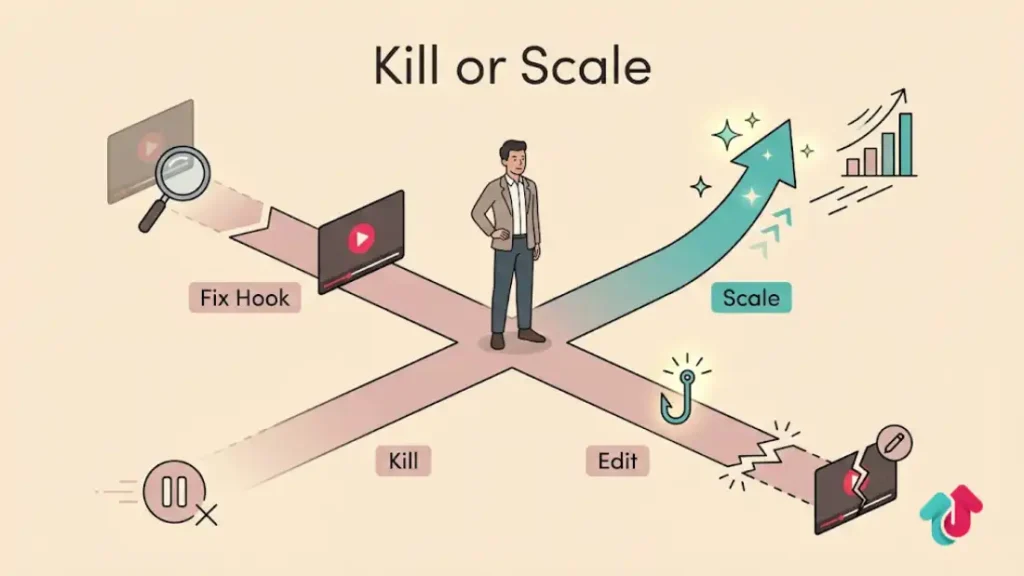
Phase 4: The Decision Matrix (Kill or Scale)
Use this logic table to make decisions without emotion.
| Scenario | Hook Rate | CTR | ROAS/CPA | Action |
| The Winner | High (>30%) | High (>1%) | High (Profitable) | Scale. Increase budget by 20%. |
| The Scroll-Stopper | High (>30%) | Low (<0.5%) | Low | Edit. Keep the hook, change the body/CTA. |
| The Boring Seller | Low (<15%) | High (>1%) | Medium | Edit. Fix the hook to get more people in. |
| The Loser | Low (<15%) | Low (<0.5%) | Zero | Kill. Pause immediately. Creative is dead. |
Explore these helpful articles next:
👉 TikTok Ads for Local Businesses: Geo-Targeting Playbook
👉 Retargeting with TikTok Ads: Remarketing Strategies That Work
👉 TikTok Ads Metrics Explained: CPC, CTR, CPM, ROAS & More
👉 TikTok Video Specs for Ads: Dimension, Ratio, Safe Zones
FAQ: Analysis Troubleshooting
My CPC is really low, but I have no sales. Why?
Check where your traffic is coming from. If you have Automatic Placements on, you might be getting cheap clicks from Pangle (gaming apps). These clicks are often accidental or low quality. Switch to TikTok Feed Only to get real intent.
What is a good CPM in 2026?
A good CPM is between $5.00 and $10.00. If your CPM is over $20, your audience is too small, or your creative quality is ranking poorly (low engagement). Try broadening your targeting (remove interests).
How long should I let an ad run before killing it?
Follow the 3x Breakeven Rule. If your target CPA is $20, let the ad spend $60 (3x). If it has zero sales after spending 3x your target, kill it. If you kill it at $10 spend, you didn’t give the algorithm a chance.
Why does my data in TikTok not match Shopify/Google Analytics?
TikTok measures View-Through conversions (people who saw the ad and bought later). Google Analytics usually only measures Last Click. TikTok will always report more conversions. The truth is usually somewhere in the middle. Use a post-purchase survey (How did you hear about us?) to verify.
Should I look at Likes and Shares?
Only as a secondary signal. You cannot pay your rent with Likes. However, a high Share count usually leads to a lower CPM because TikTok rewards viral content. If an ad has high shares, let it run a little longer even if the ROAS is slightly low.
Conclusion
Analyzing TikTok ads does not require a degree in data science. It requires looking at the metrics in the order the user experiences them.
Did you stop the thumb? (Hook Rate). Did you spark interest? (CTR). Did the website close the deal? (Conversion Rate).
By identifying exactly where the breakage happens in this chain, you stop guessing and start fixing.
Commit to this workflow every morning, respect the 72-hour attribution lag, and you will find that your bad days happen far less often.